3. Defining a new dataset
This chapter explains how to define a new dataset as a registry owner or a researcher.
3.1. From projects to new dataset
After login you are presented with your projects. This is a list of all known projects where you with the current supplied credentials have authorisations for.
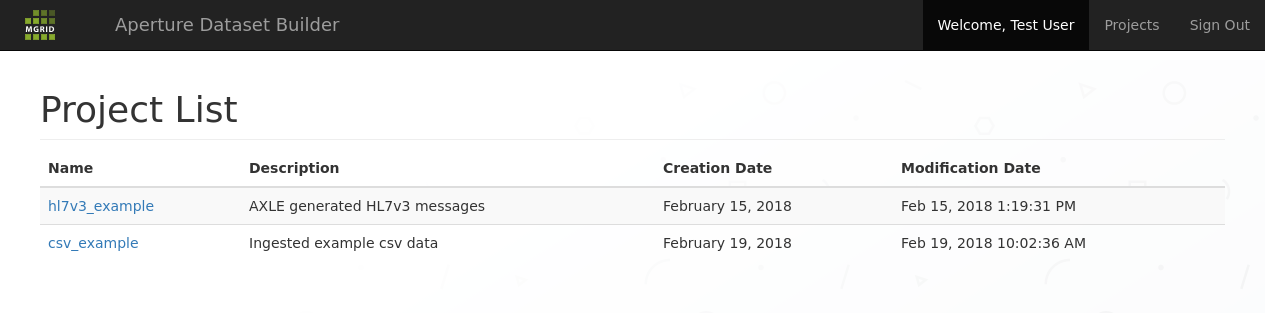
Projects list screen; shows all known projects you have authorisations for
A project ties together:
a body of data that is collected here for dataset building
a number of users that together have access to this body of data
a deidentification context; datasets constructed within this project will use the same pseudonym for the same subject
an export context; datasets that need to be exported will be exported via a preconfigured export path, and with that end up in the same place for futher analysis.
Note
As a user you can take the data present in the project for granted.
The data in a project is put there by automated conversions from organisational data sources and are managed by data stewards.
We select the CSV project and are presented with the project screen:
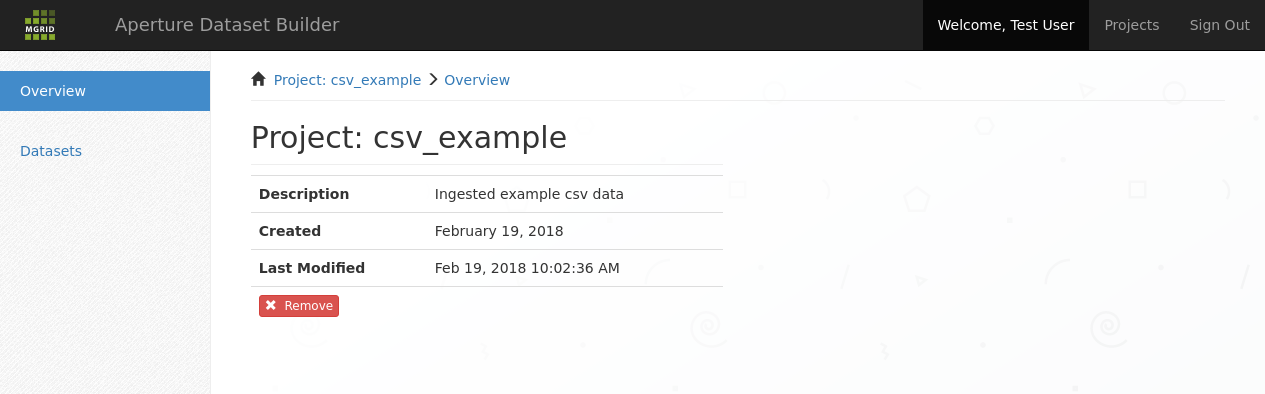
Project overview screen; shows the project context that we are going to work in
We now select ‘Datasets’ in the sidebar to end up in the datasets list screen.

Datasets list screen; shows the defined datasets within this project.
Our objective is to create a new dataset, so we enter a new name into the dataset name field and click the add button.
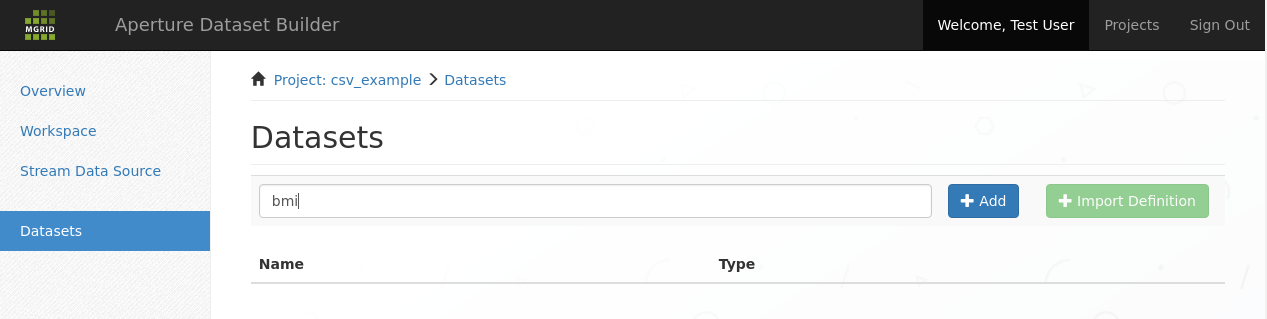
Add a dataset
After that we are invited to define our dataset in the dataset definition screen.
3.2. Define dataset tab
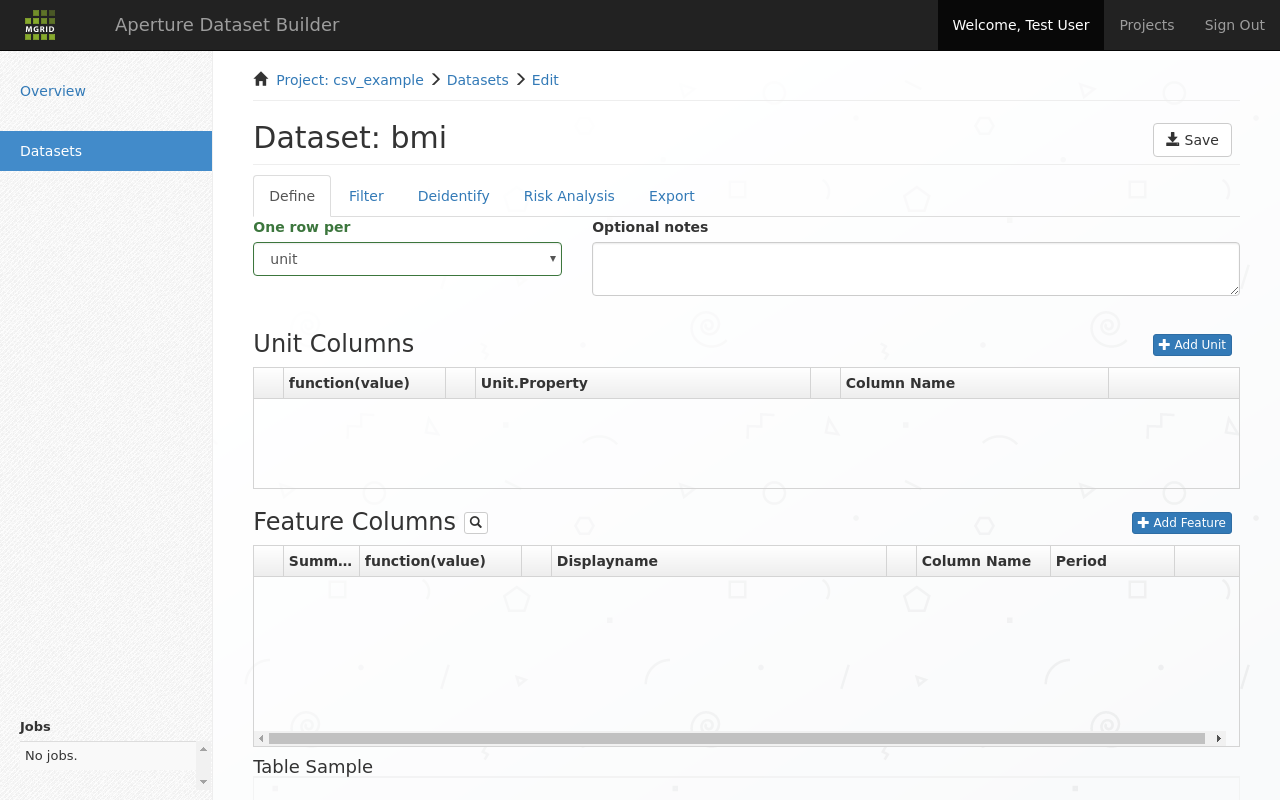
Dataset define, or dataset pivot screen
3.2.1. Features and Units
In the Dataset Builder we think of data in terms of features and units. Features are all the facts that are available in the data sources that are of interest to a researcher. Units are the dimensional attributes of the features, that allow different features to be linked together.
Given the example units:
patient (id)
practitioner organisation (id)
and example features:
blood pressure
visits
medications
We can define tables that detail per unit (patient, practitioner organisation) blood pressures, visits and medications.
Note
Available features and units are defined by your data steward. New features and units can be made available at any time during the lifetime of a project.
3.2.2. Dataset type
For this example we select the unit dataset, and click one row per unit. For an explanation of the other unit types see Dataset Types.
3.2.3. Selecting Units
The unit columns part of the data definition screen is used to select and configure the units that should be part of the resulting dataset. Units are added by clicking the add unit button and selecting a unit from the list of available units.
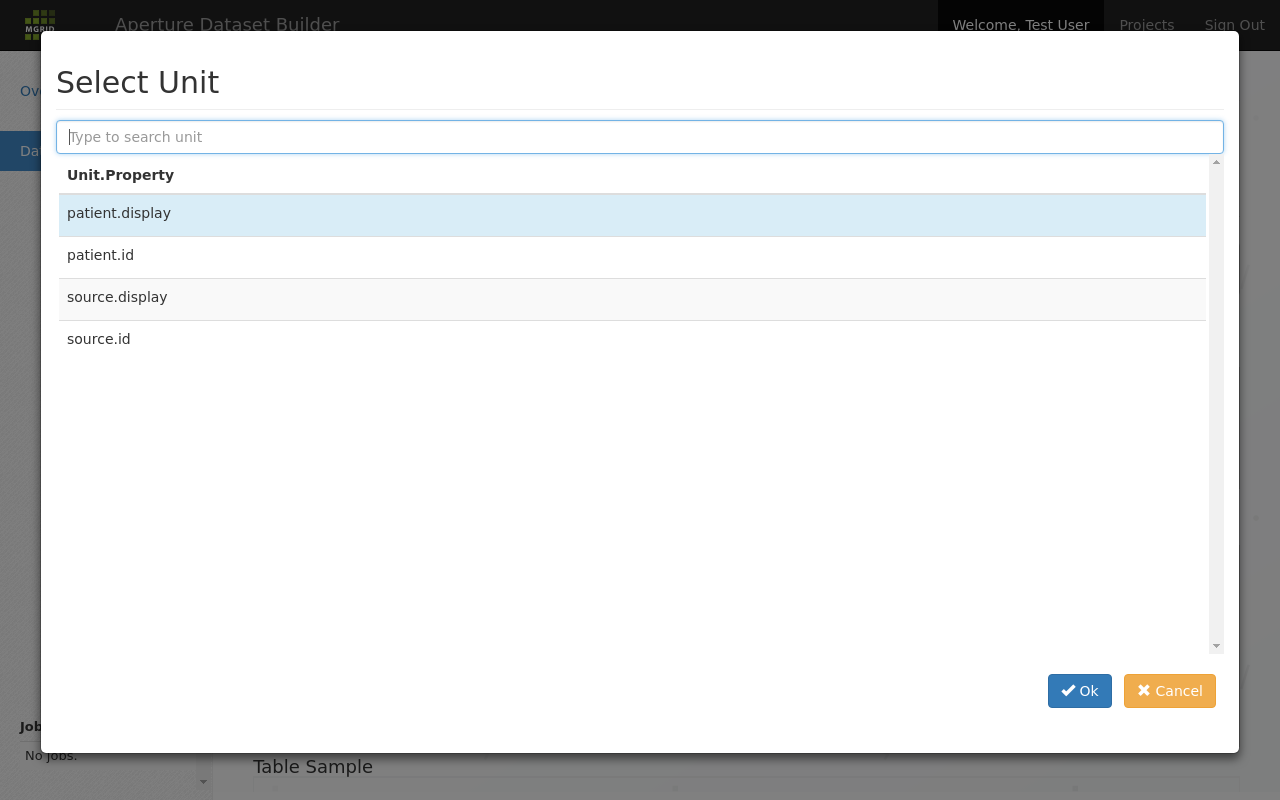
Add a unit to a dataset
After selecting a unit it appears as a row in the “Unit Columns” list. In this row the Unit.Propery part is fixed, but you are allowed to change the Column Name and “function(value)” parts:
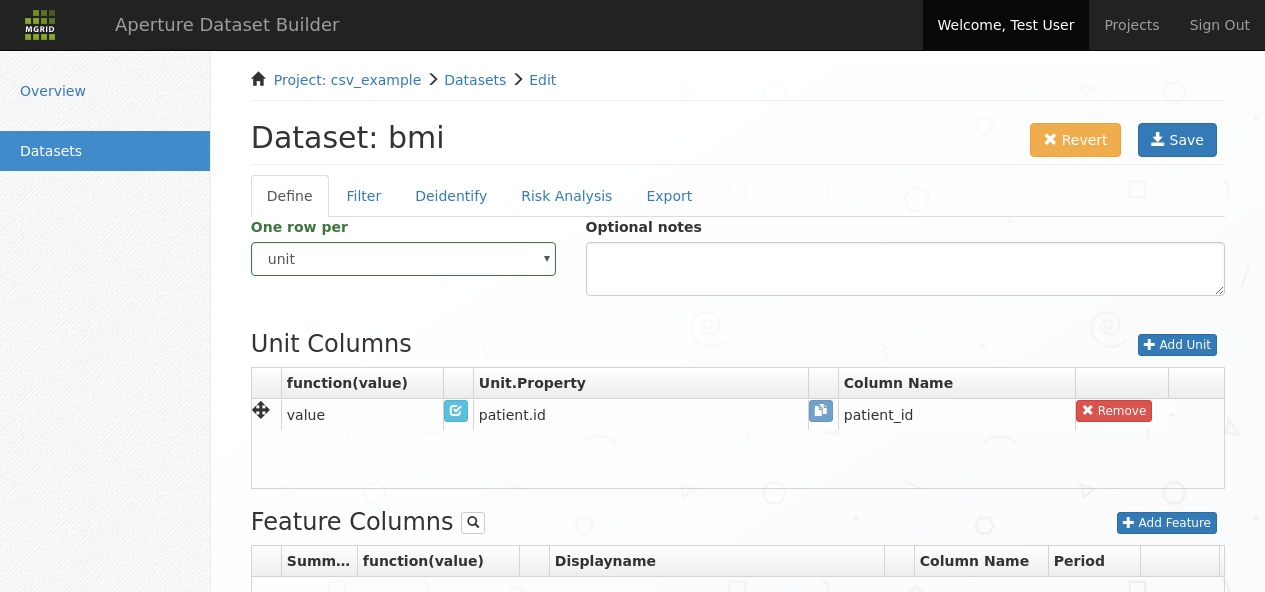
Unit added to dataset
the Column Name column can be filled in with the column name that this unit should have in the resulting dataset
the function(value) column can be filled in with a function that should be applied to the unit column before it is used in the pivot and output to the resulting Dataset. The default is normally fine.
Note
The functions that can be applied on the Unit Column depend of the datatype of this column. A default is supplied by the application, but if needed can be adjusted if a different projection of the value is needed.
Examples:
Extract a unit from a phyisical quantity unit:
unit(value)Extract a code part from a JSON unit:
value->>'code'Extract a selection of a FHIR Address Element:
parse_enad(value,'{given, prefix, family}'::text[])
The light blue validation button next to the function(value) input field can be used to verify the current expression or to explore possible functions for the current datatype.
3.2.4. Selecting features
The feature columns part of of the data definition screen is used to select and configure the features that should be part of the resulting dataset. Features are added by clicking the Add Feature.
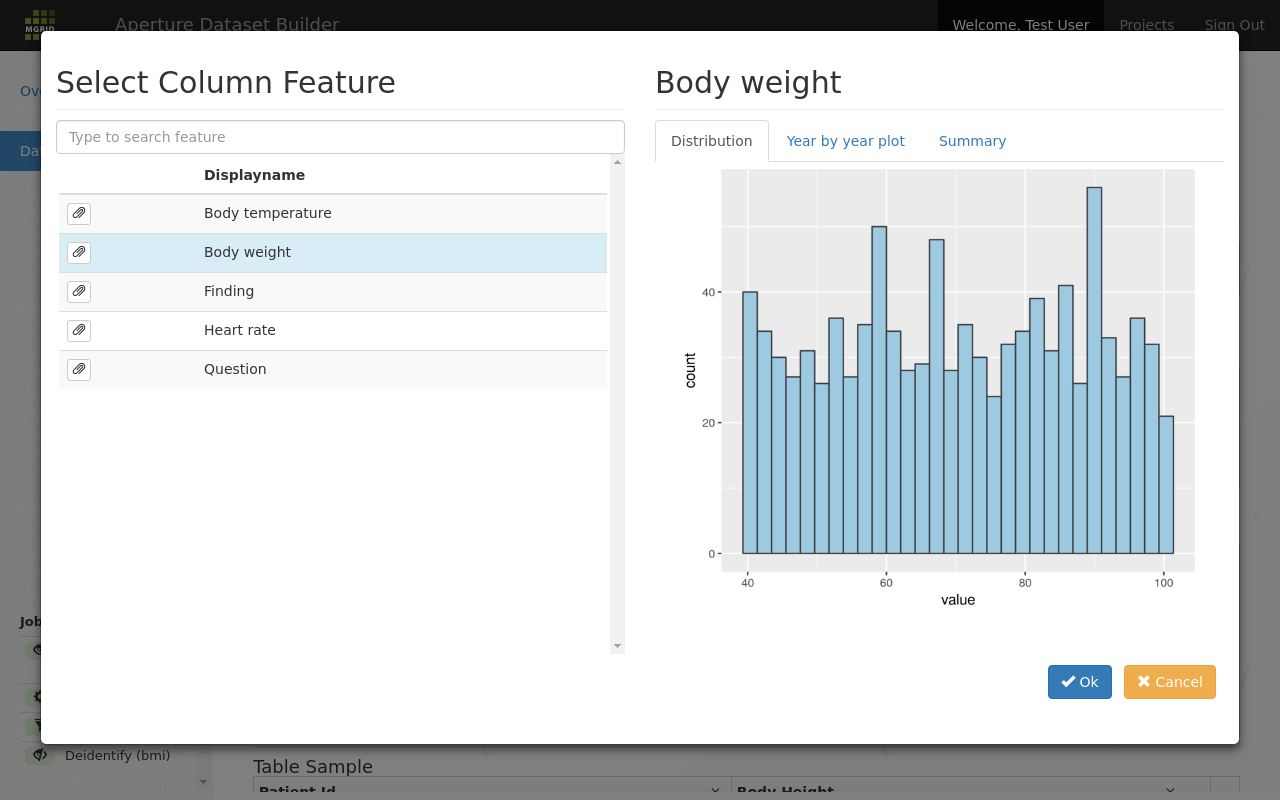
Search in the feature list for a feature to add to the dataset
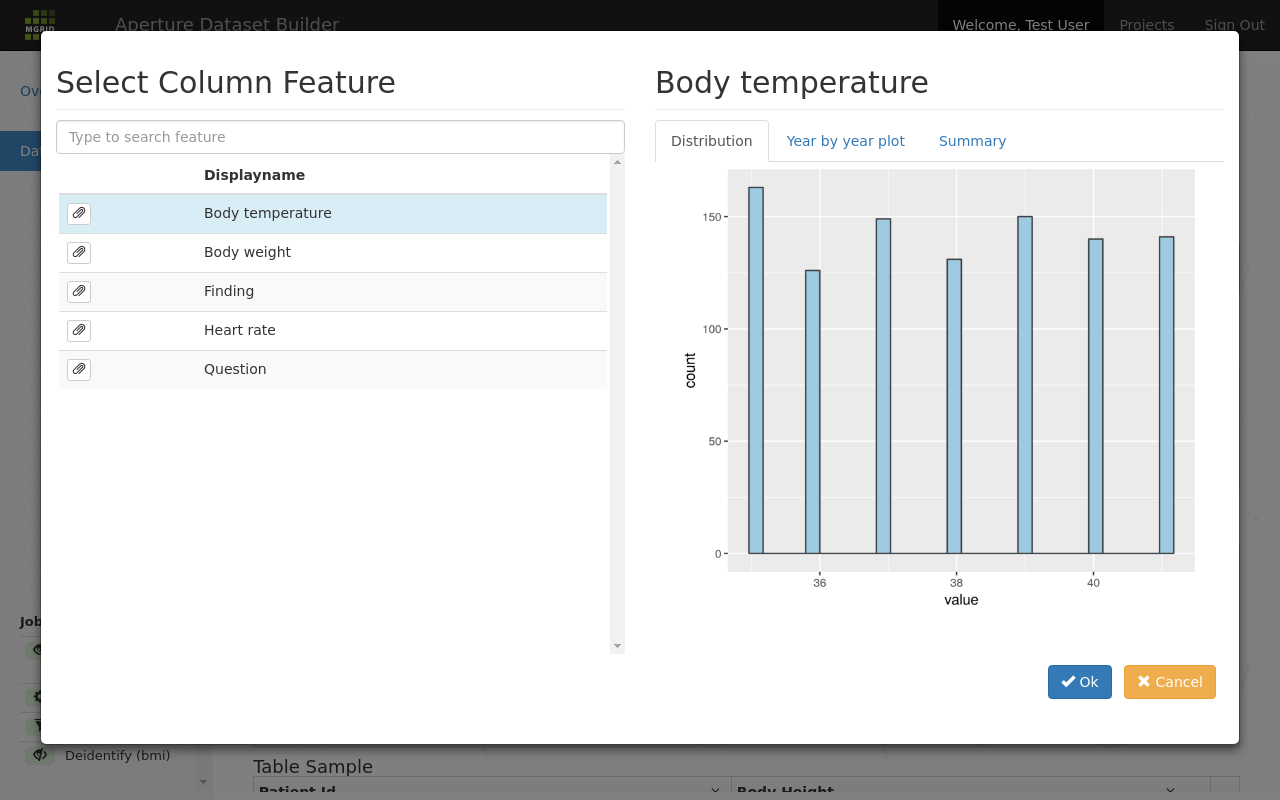
The distribution tab gives an insight in the shape of the available data for this feature. Here is a different feature:
A feature summary tab that shows the shape of the underlying data
Other tabs give more insight in the data; the year by year plot can be used to get a global feel about how the available data changes per year.
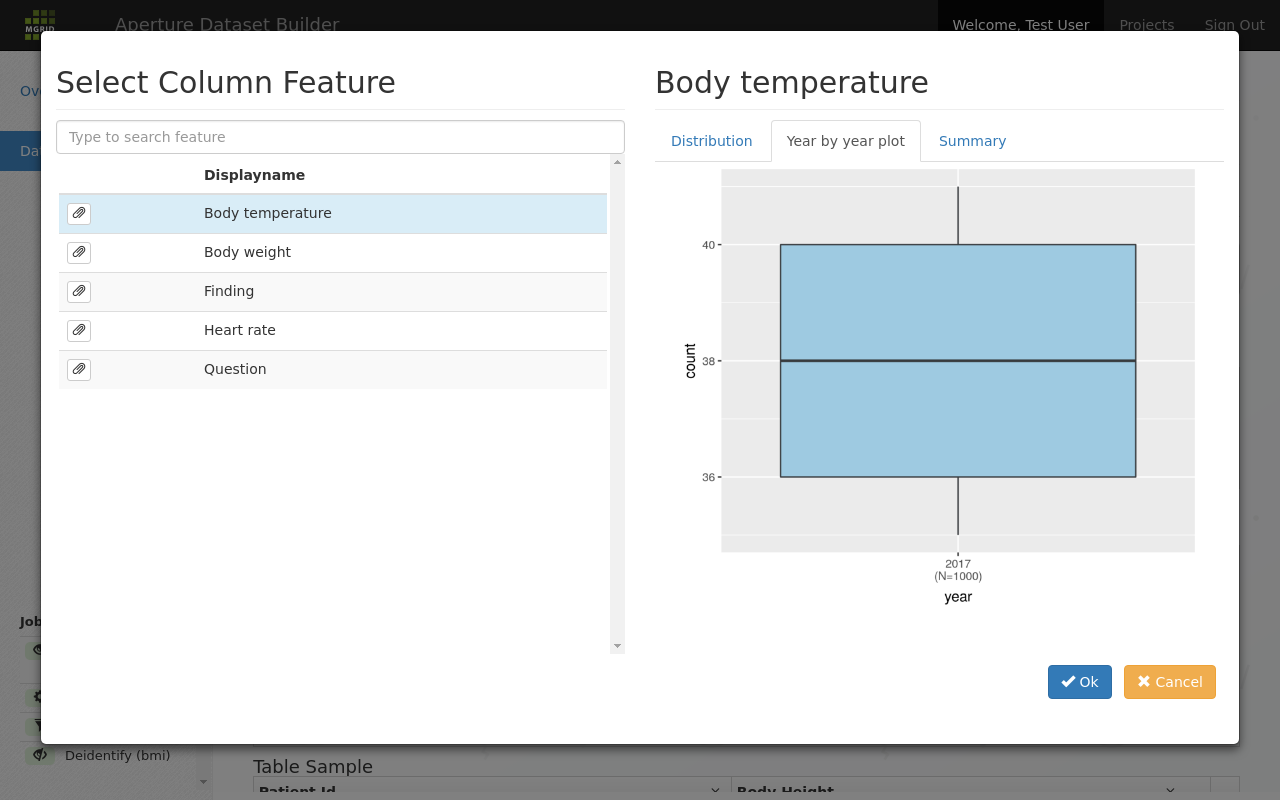
Boxplots for a feature per year can be used to determine data shape
And finally a summary shows boxplot information over all data for this feature:
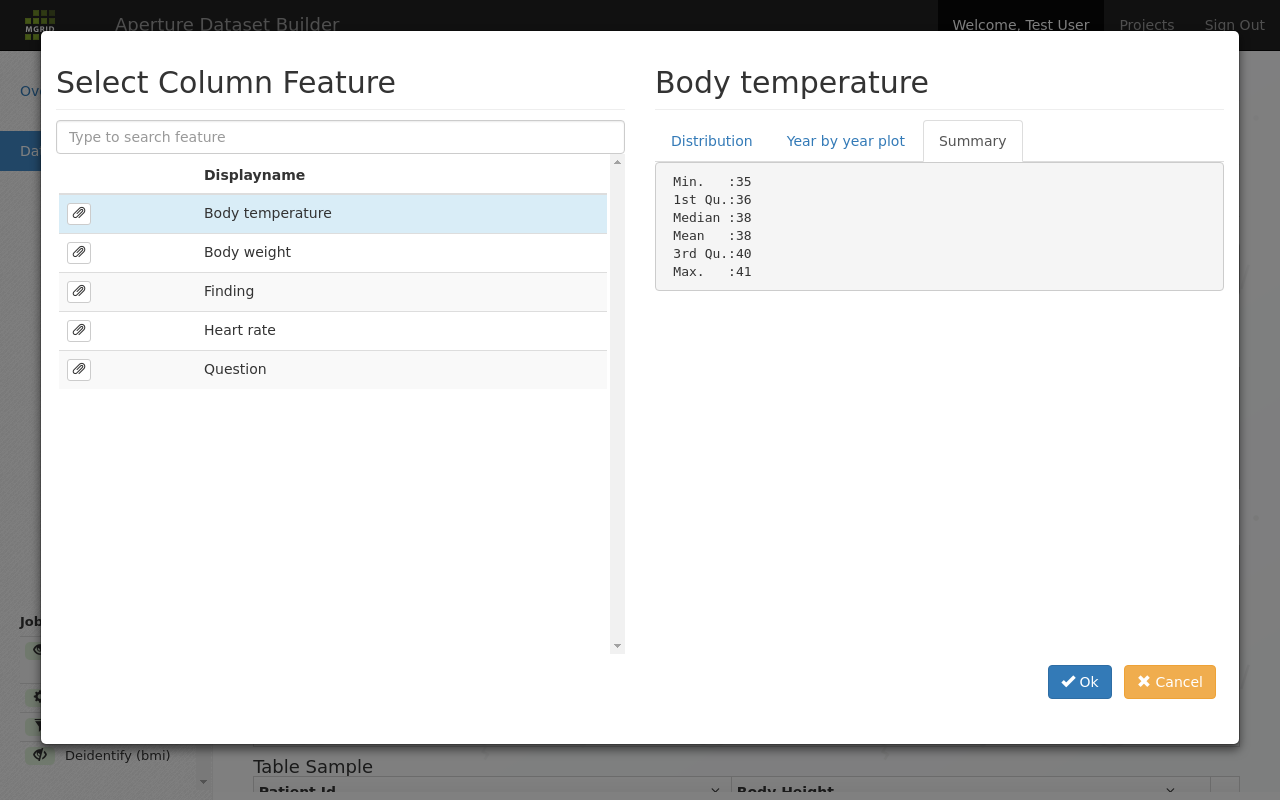
Yet another view to help get a feel for the data shape.
Once we select a feature it appears as a row in the “Feature Columns” list.
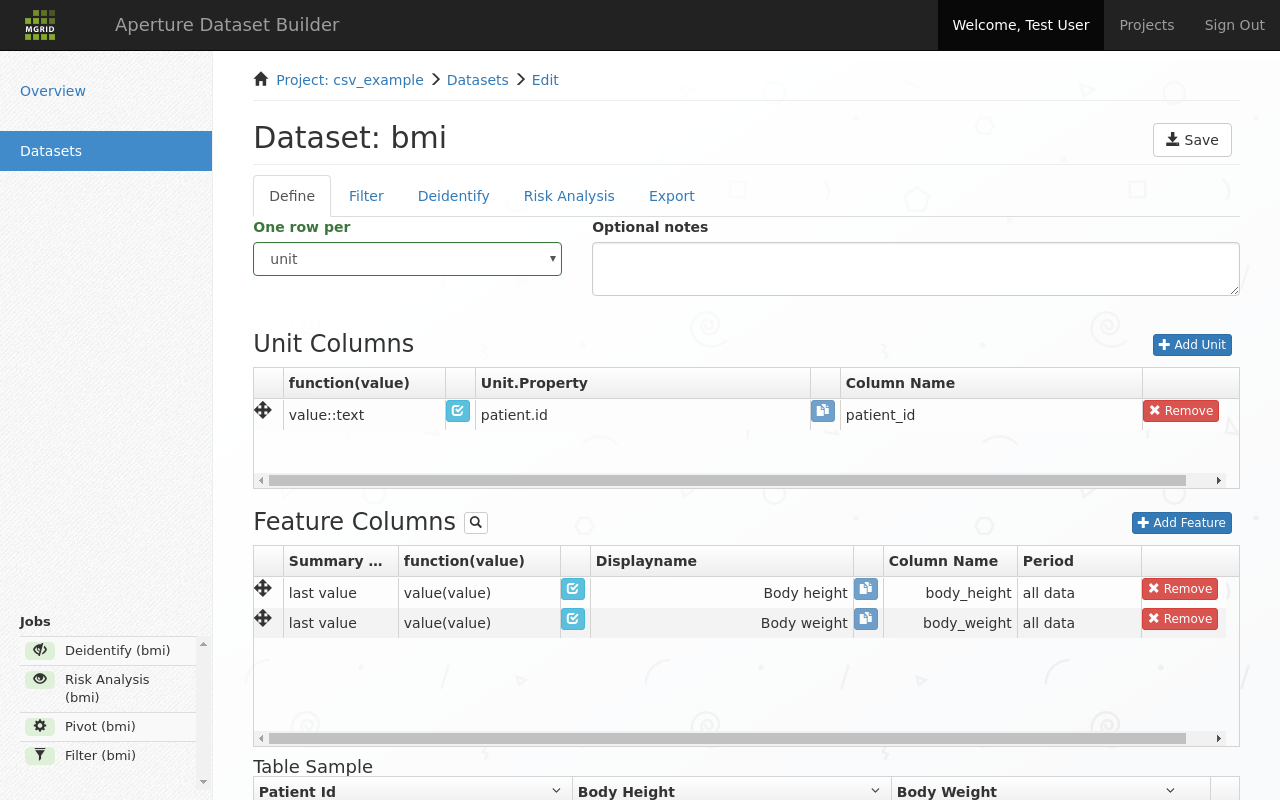
Feature added
In this row you can now configure the output you want for this feature:
summary; given that we may have multiple values of this feature, but are only allowed to emit one per unit/
patient, we need some way to summarize multiple inputs into one output. This is done by setting an aggregate. Available aggregates depend on the input type of the feature, but typical are:first value: the first value (in the given period)
last value: the last value (in the given period)
max value: the maximum value (in the given period)
count: the number of values (in the given period)
the function(value): this allows the user to apply a function on the feature column, similar to the functions used in the unit columns discussed above
the column name as it should appear in the resulting dataset
the period: this defines whether all data (default) or only a (temporal) part of the available data should be put in the dataset.
Note
Displayname is the name of the feature as defined by the data steward. While this value cannot be changed, it is only part of the definition for your dataset and will not be part of the actual export for your dataset.
Once at least one unit and at least one feature are selected and saved via the save button a table sample with the current dataset is shown.

Table sample for the current dataset
Note
Table samples can be empty when the chosen features have no values for the chosen units.
Similarly, feature columns can be empty if no unit overlap between features.
3.3. Filter tab
The filter tab allows you filter out columns and rows for your dataset. This can be to remove outlier rows, or remove columns that were needed to the dataset definition but not in the final dataset to be exported.
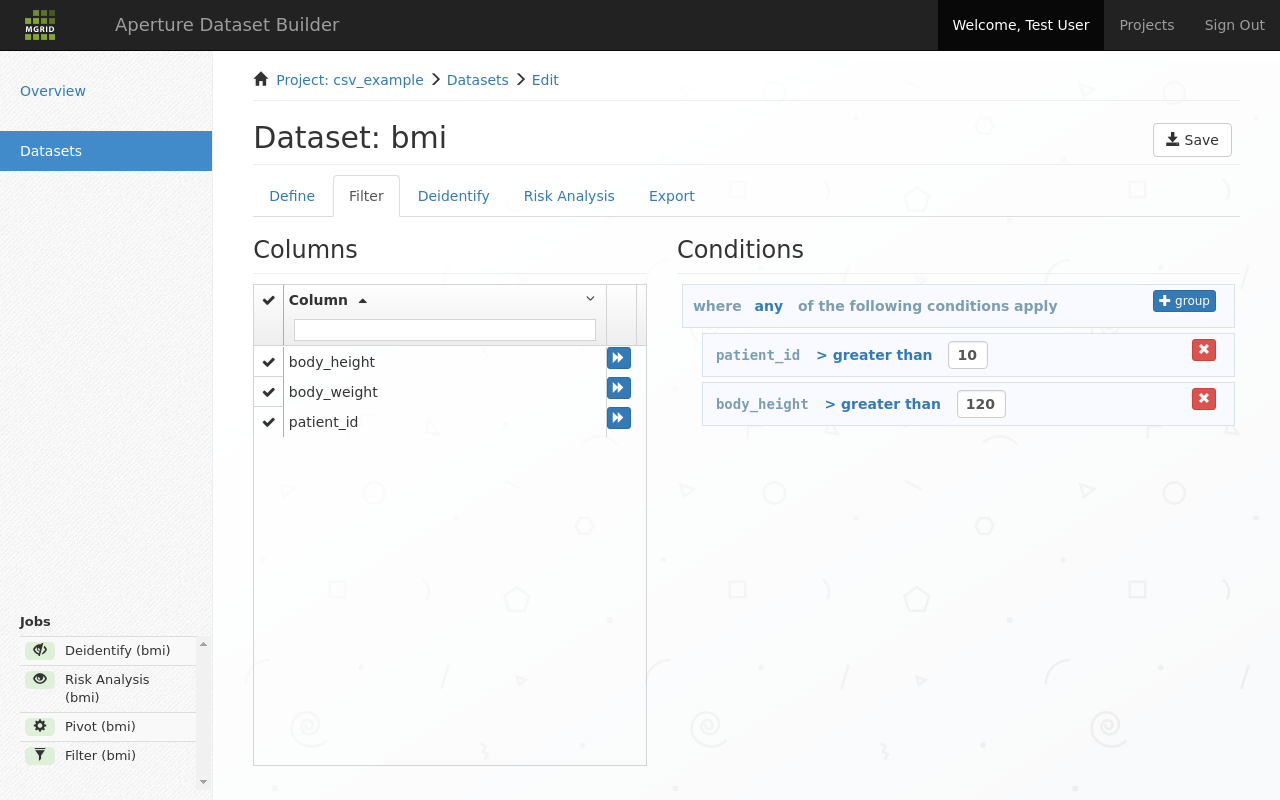
Filter out rows in the current dataset
3.3.1. Column filtering
Columns can be removed by removing the checkmark next to the column name. By default all columns are checked, so no columns are filtered out.
3.3.2. Row filtering
Rows are filtered based on the conditions. Conditions are grouped sets of expressions on columns. Groups are evaluated as:
any: if one of the contained expressions returns true, the row is passed through.
all: all of the contained expressions must return true for the row to be passed on.
New expressions can be added by clicking the forward button next to a column name. At that time a new filter expression is added to the condition list on the right. Conditions can be dragged to the appropriate grouping level.
The dark blue operator field is clickable, and allows known operators to be set. Similarly, the text field to the right of the operator allows you to complete the operator expression.
3.4. Deidentify tab

Define deidentification profile
To support follow-up for critical findings it is important to mask patient information for researchers and analysts in such a way as to allow authorised reidentification.
For each column the following deidentification actions can be applied:
keep: the column is kept unaltered
drop: the column should be dropped
pseudonymize: the column is pseudonymized using the deidentification server, and the column is replaced by the received pseudonym.
pseudonym: this column contains a pseudonym.
drop and store in keyfile: this column is sent to the deidentification server as additional information to be stored with the active pseudonym for this row. The column is then deleted.
anonymize: apply a masking function on this column.
Function |
Arguments |
Description |
|---|---|---|
agegroup |
reference_date, bin_size |
Modify a date to an age group, using reference_date as a base, and using bins of bin_size years. |
monthyearfromdate |
Get the ‘Mon Year’ for the current timestamp or date value |
|
numbergroup |
bin_size |
Return the bin for the current value, given a bin_size |
yearfromdate |
Given a date, return only the year |
Note
A deidentification profile is defined for a project by the data steward. All datasets within one project use the same deidentification profile. This allows different datasets exported for the same DSB project to be joined on pseudonym after the fact.
3.5. Risk Analysis tab
The use of this tab is optional. It allows you to determine the risk of reidentification.
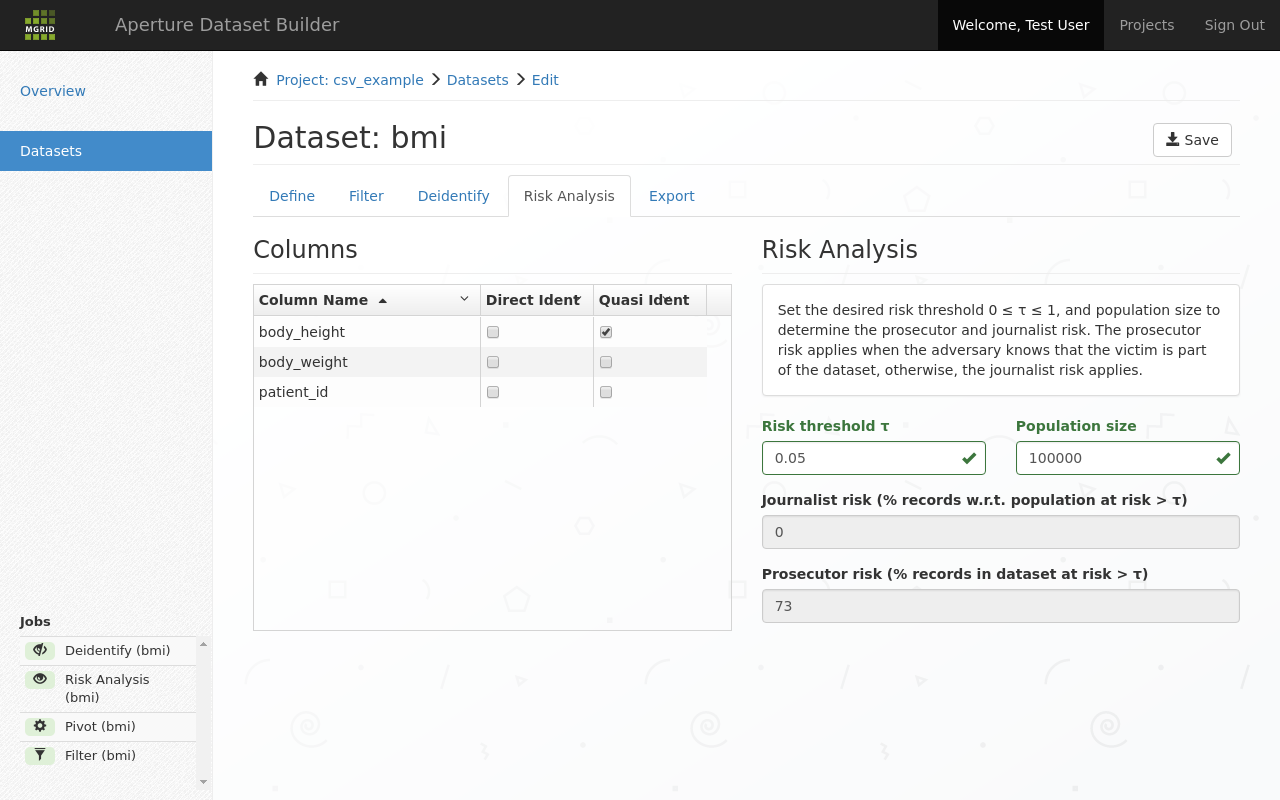
Determine risk of reidentification
For each column you can indicate if it is a direct identifier, or a quasi identifier. A quasi identifier would be the height of a person, especially if the recorded height is an outlier.
Note
Direct identifiers should no longer be present here. If they are they should be dropped in the filter tab, or pseudonymized in the deidentification tab. A direct identifier at this stage would allow anybody to pinpoint the person identified in a data row.
The equivalence classes based on the quasi identifiers are calculated. If the classes are large enough / have enough members, the quasi identifier does not allow reidentification with only this dataset.
journalist risk is the risk of reidentification, given that identifyable persons are drawn from a population and journalist has no knowledge that particular persons are part of this dataset.
prosecutor risk is the risk of reidentification, given that the prosecutor has knowledge that a particular person is part of the dataset.
3.6. Export tab
Depending on the DSB configuration a number of export methods are available on this tab:
3.6.1. Scheduled table export
Export this dataset as a table into an upstream datawarehouse periodically. Typically used for data that is streamed into DSB, and then using one or a set of dataset definitions is periodically transformed to upstream datawarehouse tables.
3.6.2. Direct export
Perform the export action now. Can be tied to a datawarehouse table upstream, or an Aridhia XAP workspace.
3.6.3. Workspace export
Upload the dataset to a known workspace for the current user. This action will require permission of the (provisioned) owner of the dataset, and if allowed will result in re-deidentification for that workspace.
3.6.4. Download CSV
Download the current dataset as CSV.
3.6.5. Download the definition of the dataset
Can be used to retrieve the current definition of this dataset in a YAML file. This YAML can be also be used to redefine a dataset and is helpful to automate creation of similar datasets.