6. Dashboard
Note
The monitoring components of XFM are not yet available for version 3.
XFM includes a dashboard to show various metrics of the system. The dashboard
can be accessed through a web browser (it listens on port 5000 on the
management server).
See below for a screenshot of a live dashboard.
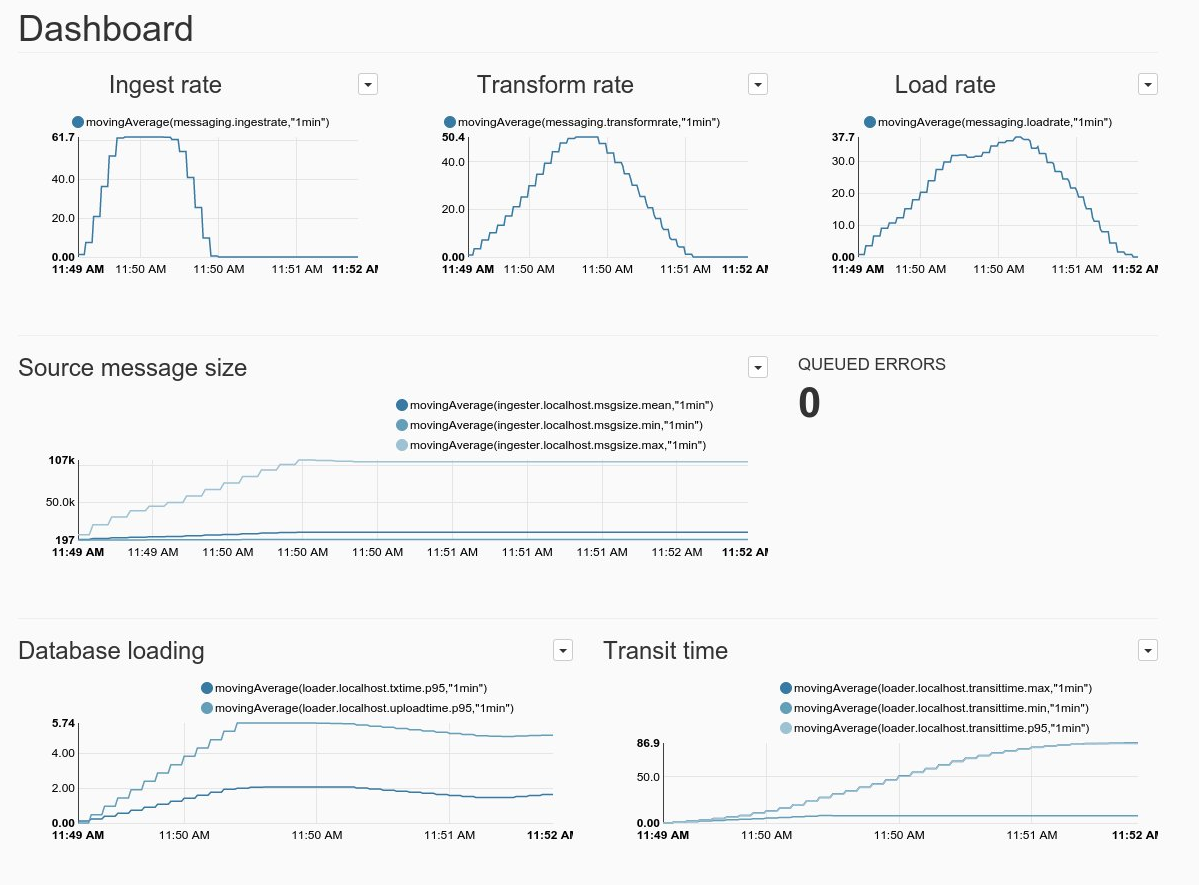
By default it contains the following figures (moving averages use a window size of 1 minute):
- Ingest rate: the moving average of the rate with which the ingesters send (non-error) messages to the broker (messages per second).
- Tranform rate: the moving average of the rate with which the transformers send (non-error) messages to the broker (messages per second).
- Load rate: the moving average of the rate with which the loaders load messages in the data lake. Actually this number represents the message acknowledgement rate back to the broker (messages per second).
- Source message size: the moving average of the minimum, maximum, and mean messages size of ingested messages (bytes).
- Queued errors: the number of error messages on the message broker. This is a
sum of the error messages in the
errors-ingress,errors-transform, anderrors-sqlqueues. - Database loading: the moving average of the 95th percentile of the time it takes to commit a message group to a data pond, and upload time to the data lake (including any pre-processing on the data pond).
- Transit time: the moving average of the minimum, maximum, and 95th percentile of the time it takes for a message to transit XFM (from ingestion up to and including uploading to the data lake).